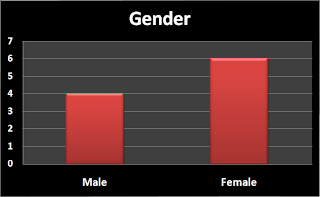
Once we had got back our audience feedback from the questionnaires we handed out, we had tallied them and added them onto a graph using Microsoft Excel.
Below are our shown results for a few of the questions:
 From this graph we can see that we asked more females than males, so to make the results more fair we should make sure to ask both males and females equally so we can get a more consistent result.
The results from this graph show that our audience are quite of a fan of watching horror movies as they tend to see them a lot within a year. Therefore this tells us that we are going towards a good genre, the Horror genre, as our audience like watching these types of films.

Asking this question to our audience helped us to see what they prefer more as a convention, trailer, magazine or poster. We had asked this question because these are the three that we are creating towards our film publicity campaign so we need to see which one has more of a effect on our audience. From the results we can see that the audience prefer watching trailers.

No comments:
Post a Comment